Becoming Computational - Final Project
The project aims to employ computational tools to analyze the features of building footprints. Two primary algorithms are utilized in this project: t-SNE (a dimensionality reduction algorithm), and K-means (a classification algorithm).
The project focuses on visual representation of data, yet strives to bridge the gap between technical and design schools.

Partial Map of Copenhagen
Footprint Area
Footprint area of buildings was measured in square meters.
Footprint Compactness
The compactness of each footprint is, in essence, how rectangular a footprint is.
Number of Vertices
The number of vertices of buildings’ footprints was measured to indicate complexity of contours.
Convex-Hull/Area Ratio
The CHAR of each footprint is, in essence, how circular each footprint is.
Building Density
The building density is measured as an average distance from the center of each building to the centers of the 30 nearest buildings.
Building Orientation
The building orientation is taken as the orientation of the bounding box’s’ dominant axis
Aspect Ratio
The aspect ratio is measured as according to the two dimensions of the most compact bounding box.
t-SNE & K-means
t-SNE (t-distributed Stochastic Neighbor Embedding) is a dimensionality reduction algorithm that takes high-dimensional data—such as 7 different metrics describing building footprints—and maps them into a lower-dimensional space, typically 3 dimensions for visualization. It does this by preserving local similarities: buildings with similar metric profiles remain close in the 3D output space, while dissimilar ones are placed farther apart. The result is a 3D cluster visualization where each point represents a building footprint, and spatial proximity within the cluster reflects similarity in their original 7-metric profiles.
K-means clustering is an unsupervised machine learning algorithm that categorizes data points into a predefined number of groups—in this case, 11. After t-SNE reduces the building footprint metrics into a 3-dimensional space, K-means analyzes the spatial distribution of these points and partitions them into 11 clusters based on their proximity to each other. It does this by iteratively assigning each point to the nearest of 11 centroids (representing cluster centers) and updating those centroids until the assignments stabilize. The result is a categorization of the data into 11 distinct groups, each representing a pattern or type of building footprint based on the original 7 metrics.
The cluster is then laid out in 2D space to observe patters in footprint morphology.
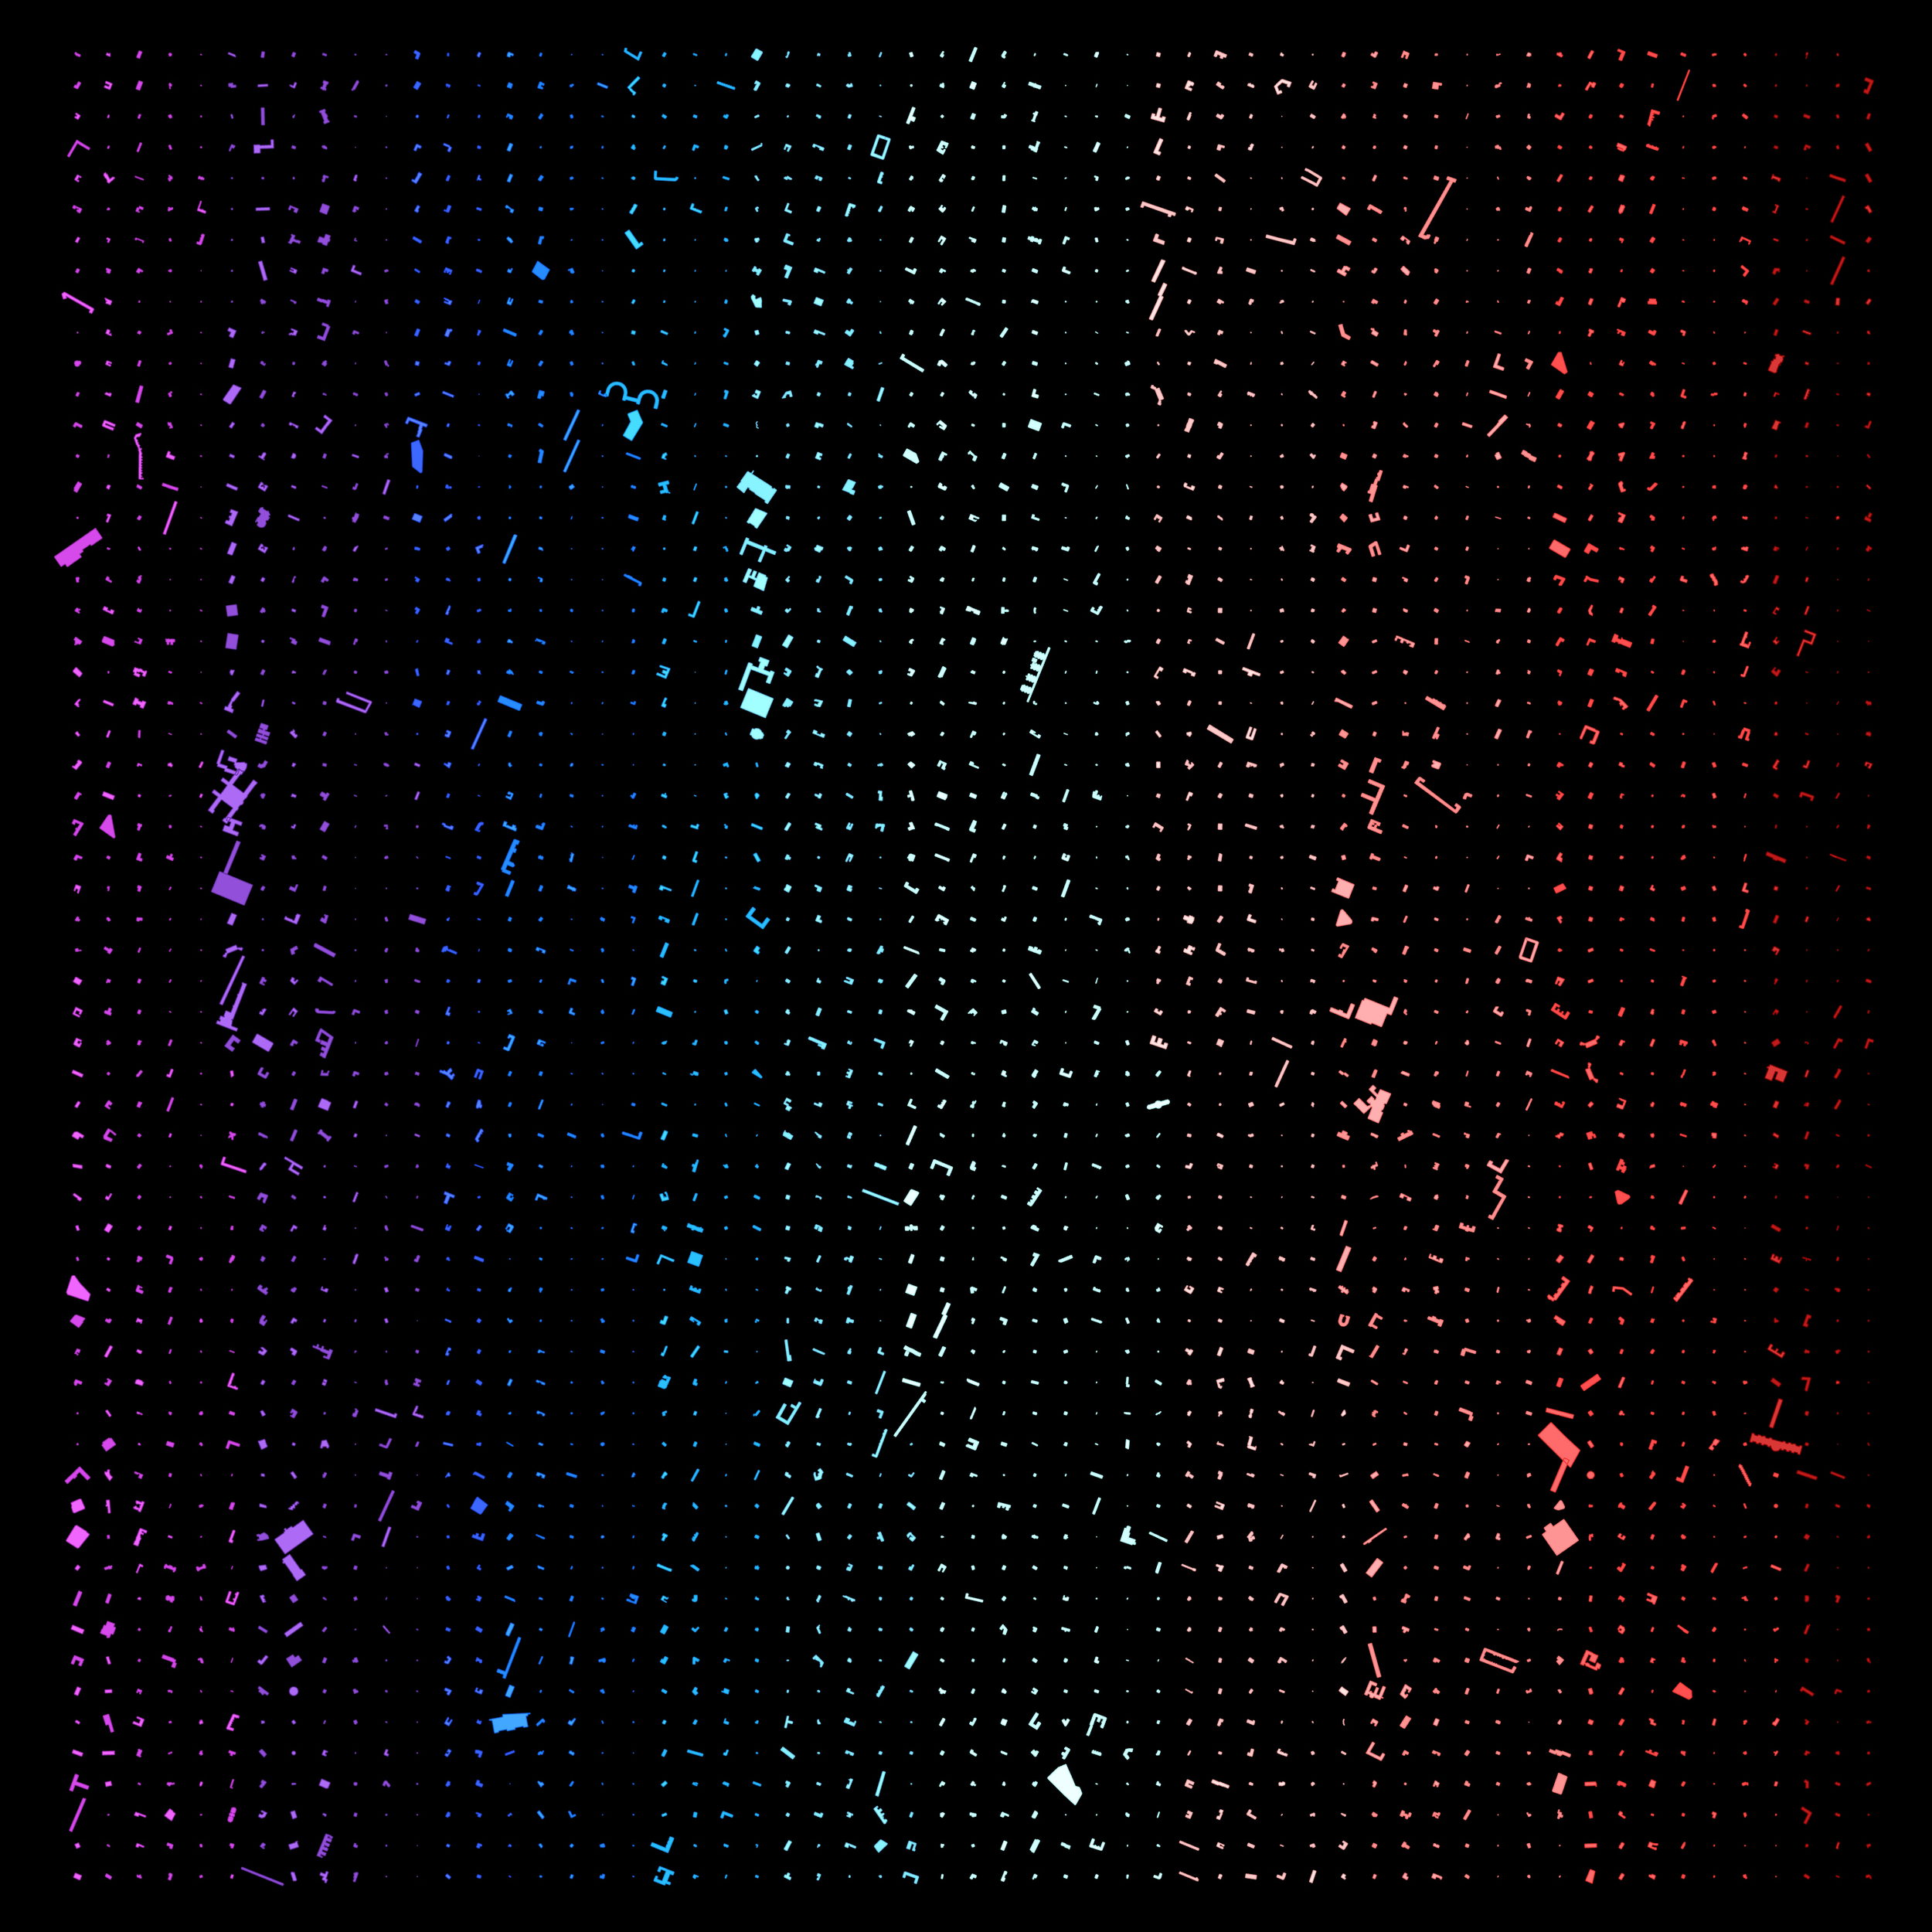
Finally, the group annotations were plotted onto the Copenhagen map to observe relation to location and actual proximity and trends.

Color-coded street map of an urban area on a black background, with buildings and streets highlighted in pink, blue, purple, and white. t-SNE and K-means urban footprint morphology analysis on Copenhagen.